
Workshop email analytics provide in-depth insight into how your messages and campaigns are performing, how effective your communication strategy is, and what teams are more informed.
To review email analytics, first visit your Email tab in Workshop, and select any sent email to get started.
Email summary
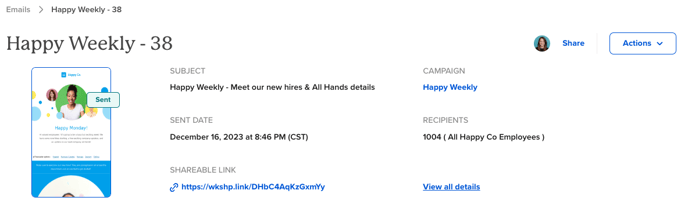
The email summary shares important logistical information about the email you sent. Email subject, author, recipients, and more are all included here.
View the web version of the email by hovering over the thumbnail image and select View email.
In the top right corner of the summary within ACTIONS, you can export a report, clone or create a new template from this email.
Engagement Overview
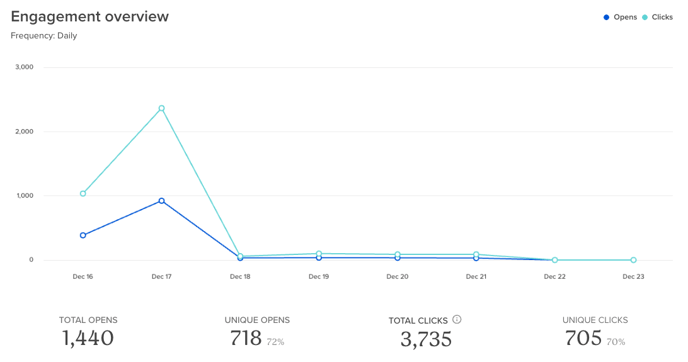
Engagement overview provides details about open and click rates within the adjustable time period in the top right corner of the tile. Engagement data definitions:
- Total opens: every open event recorded for an email, including potential multiple opens per recipient. ex: 10 recipients each opened the email twice, total opens would be 20.
- Unique opens: counts how many recipients opened the email. Does not count multiple opens, or the same individual opening on another device. ex: an email was sent to 100 people and 90 opened the email, unique opens is 90, and open rate is 90%.
- Total clicks: every tracked click event recorded for an email, including multiple clicks on separate links or repeat clicks on same links.
- Unique clicks: counts how many recipients clicked any clickable content in your email. Does not count multiple clicks on the same or different links.
Time read
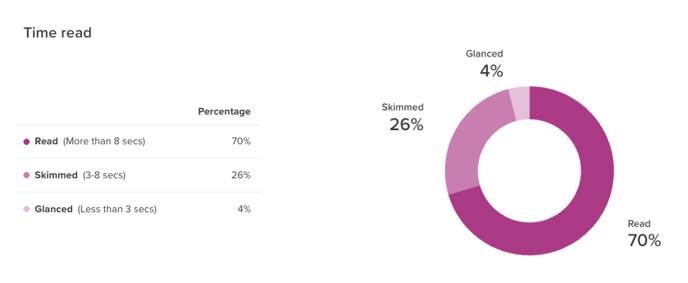
With the time read analytics, view what percentage of your audience is just skimming the surface, and who is taking the time to read and really absorb the message. This comes in handy if the communications you're sending include critical information or important company newsletters.
- Read (More than 8 seconds)
- Skimmed (3-8 seconds)
- Glanced ( Less than 3 seconds)
Engagement timeline
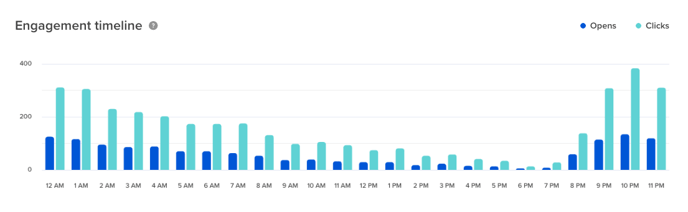
The engagement timeline helps identify trend in engagement at specific times of the day. This can help you determine what times are best for sending out communications based on the highest open and click-through rates.
- Opens and clicks - aggregates and displays these based on the hour the action happened according to the set timezone for your account.
- Counts are stated as total opens and clicks, so if recipients are opening and clicking more than once, all of those events will be reflected in this view.
Devices
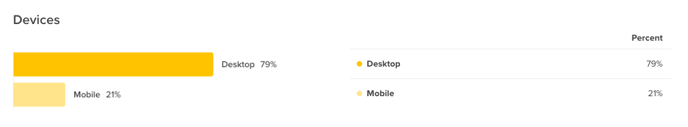
Devices data surfaces from which platform your recipients are viewing this email. Use this data to inform your email design choices and optimize for which device is viewed most frequently.
Counts are stated as total counts, so all views from all recipients will count towards the total percentage.
Web visits
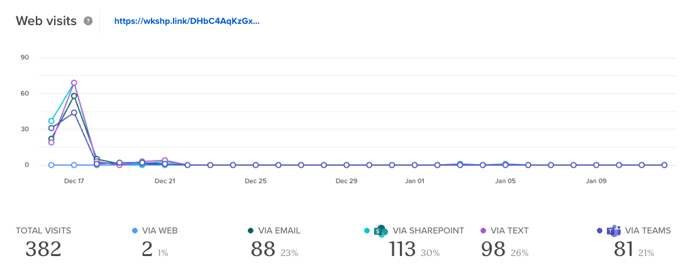
Depending on your plan, you may have additional integrations to cross-post your message into channels like Slack, SMS, Sharepoint or Teams. When sending an email, you have the option to post to these additional channels via link to the web version of the email.
Web visits display from which channel recipients are finding your email. This data will help you determine which channels are most effective and where to share in the future.
Clicks
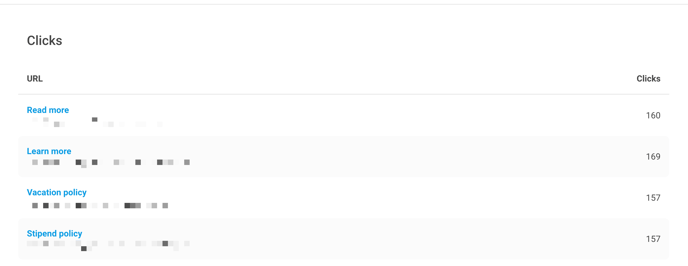
Clicks measures the total clicks for all links contained in the email.
Pro tip: in some cases, you may use this as a measuring stick for how far recipients make it through an email.
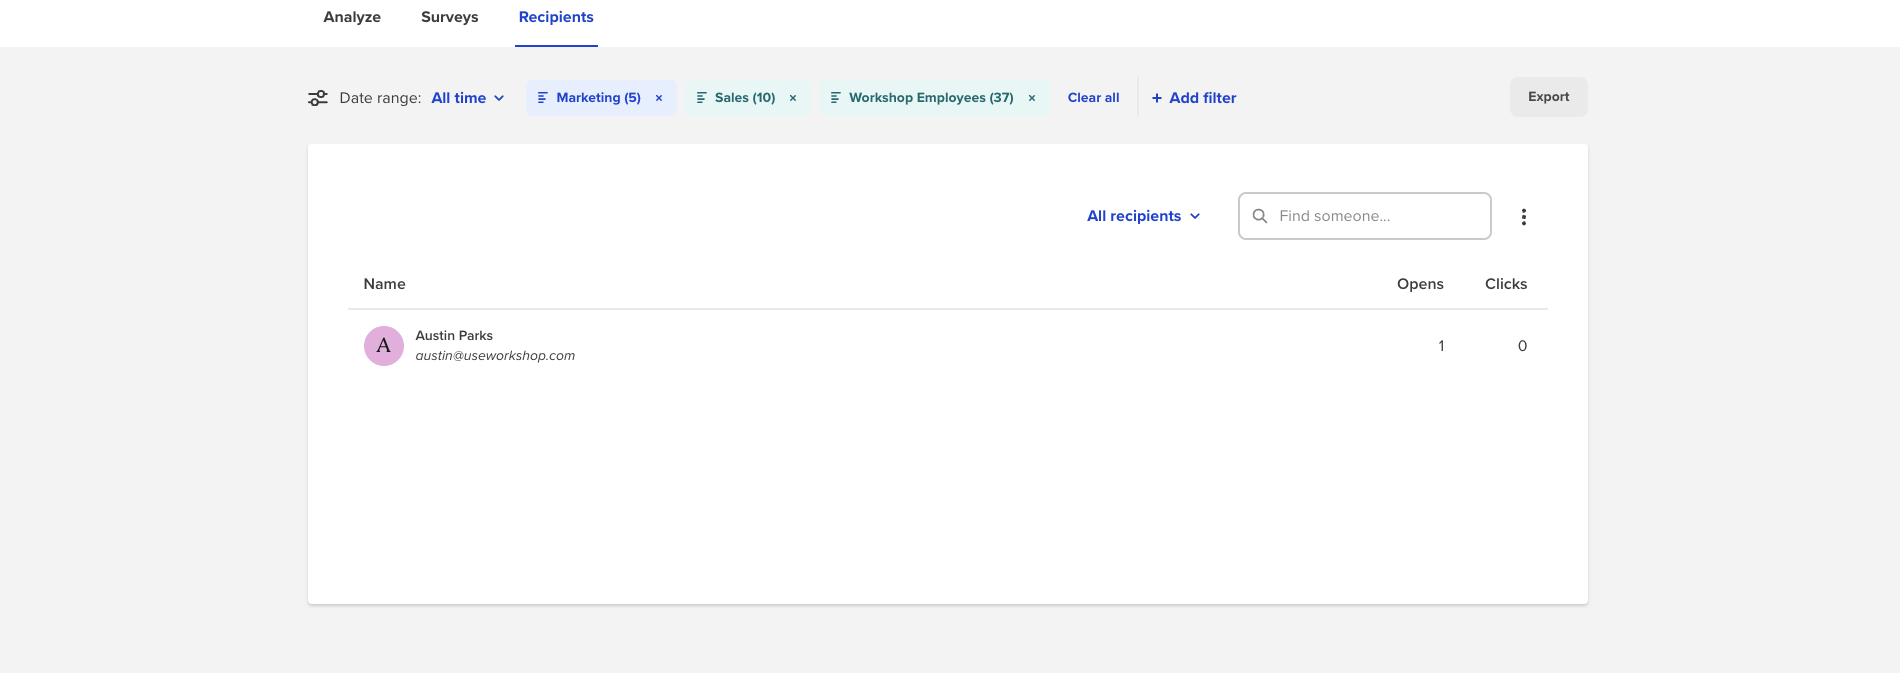
Filtering analytics

On top of all these insights and data points, you can dig even deeper into analytics by filtering by any of your active distribution lists that sync to Workshop or have been manually created. Use filters to gain insight into how sub groups at your organization are engaging with your email.
Click on Filter option located to the right of the Analyze tab. Select one (or more) of the distribution lists and Save.
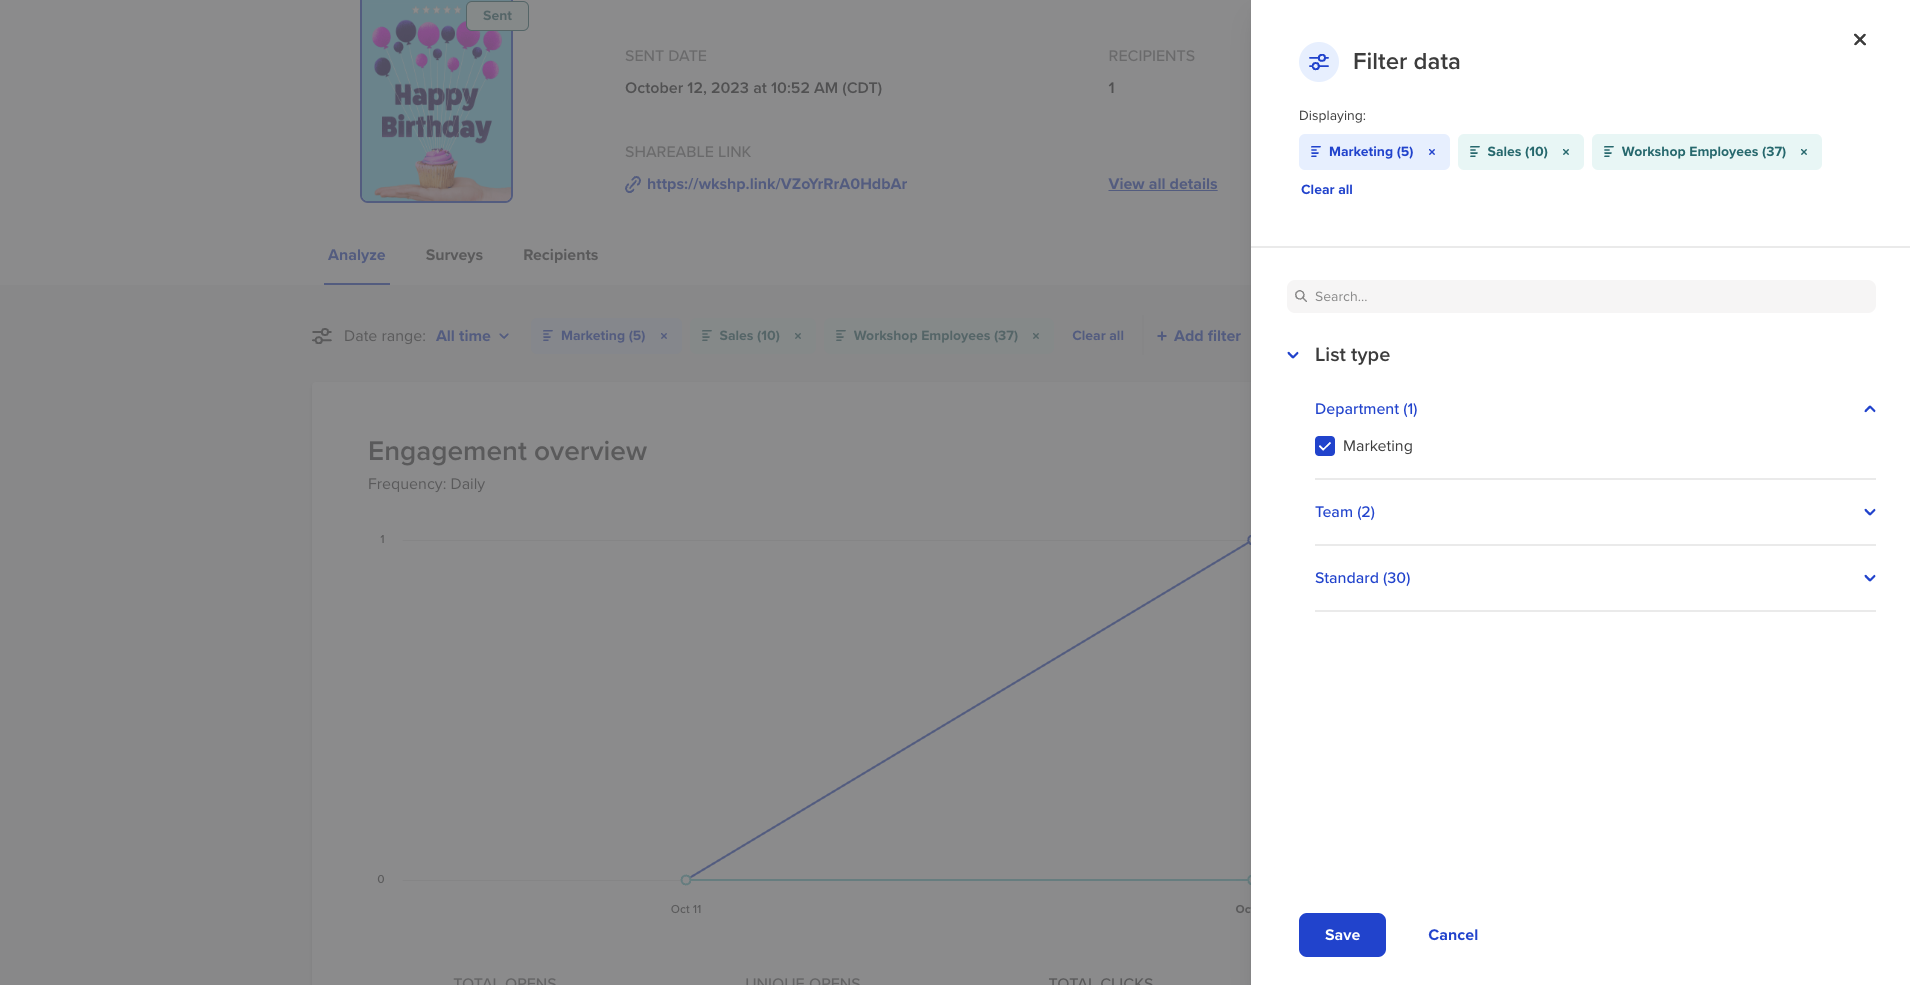
This automatically adjusts each of the data points to reflect the engagement of that specific list. Filtering at this level can be very helpful especially if you're needing to track engagement of a specific group of people within your organization.
Take this further to create a filtered view on your other analytics tabs: Surveys and Recipients.
Surveys
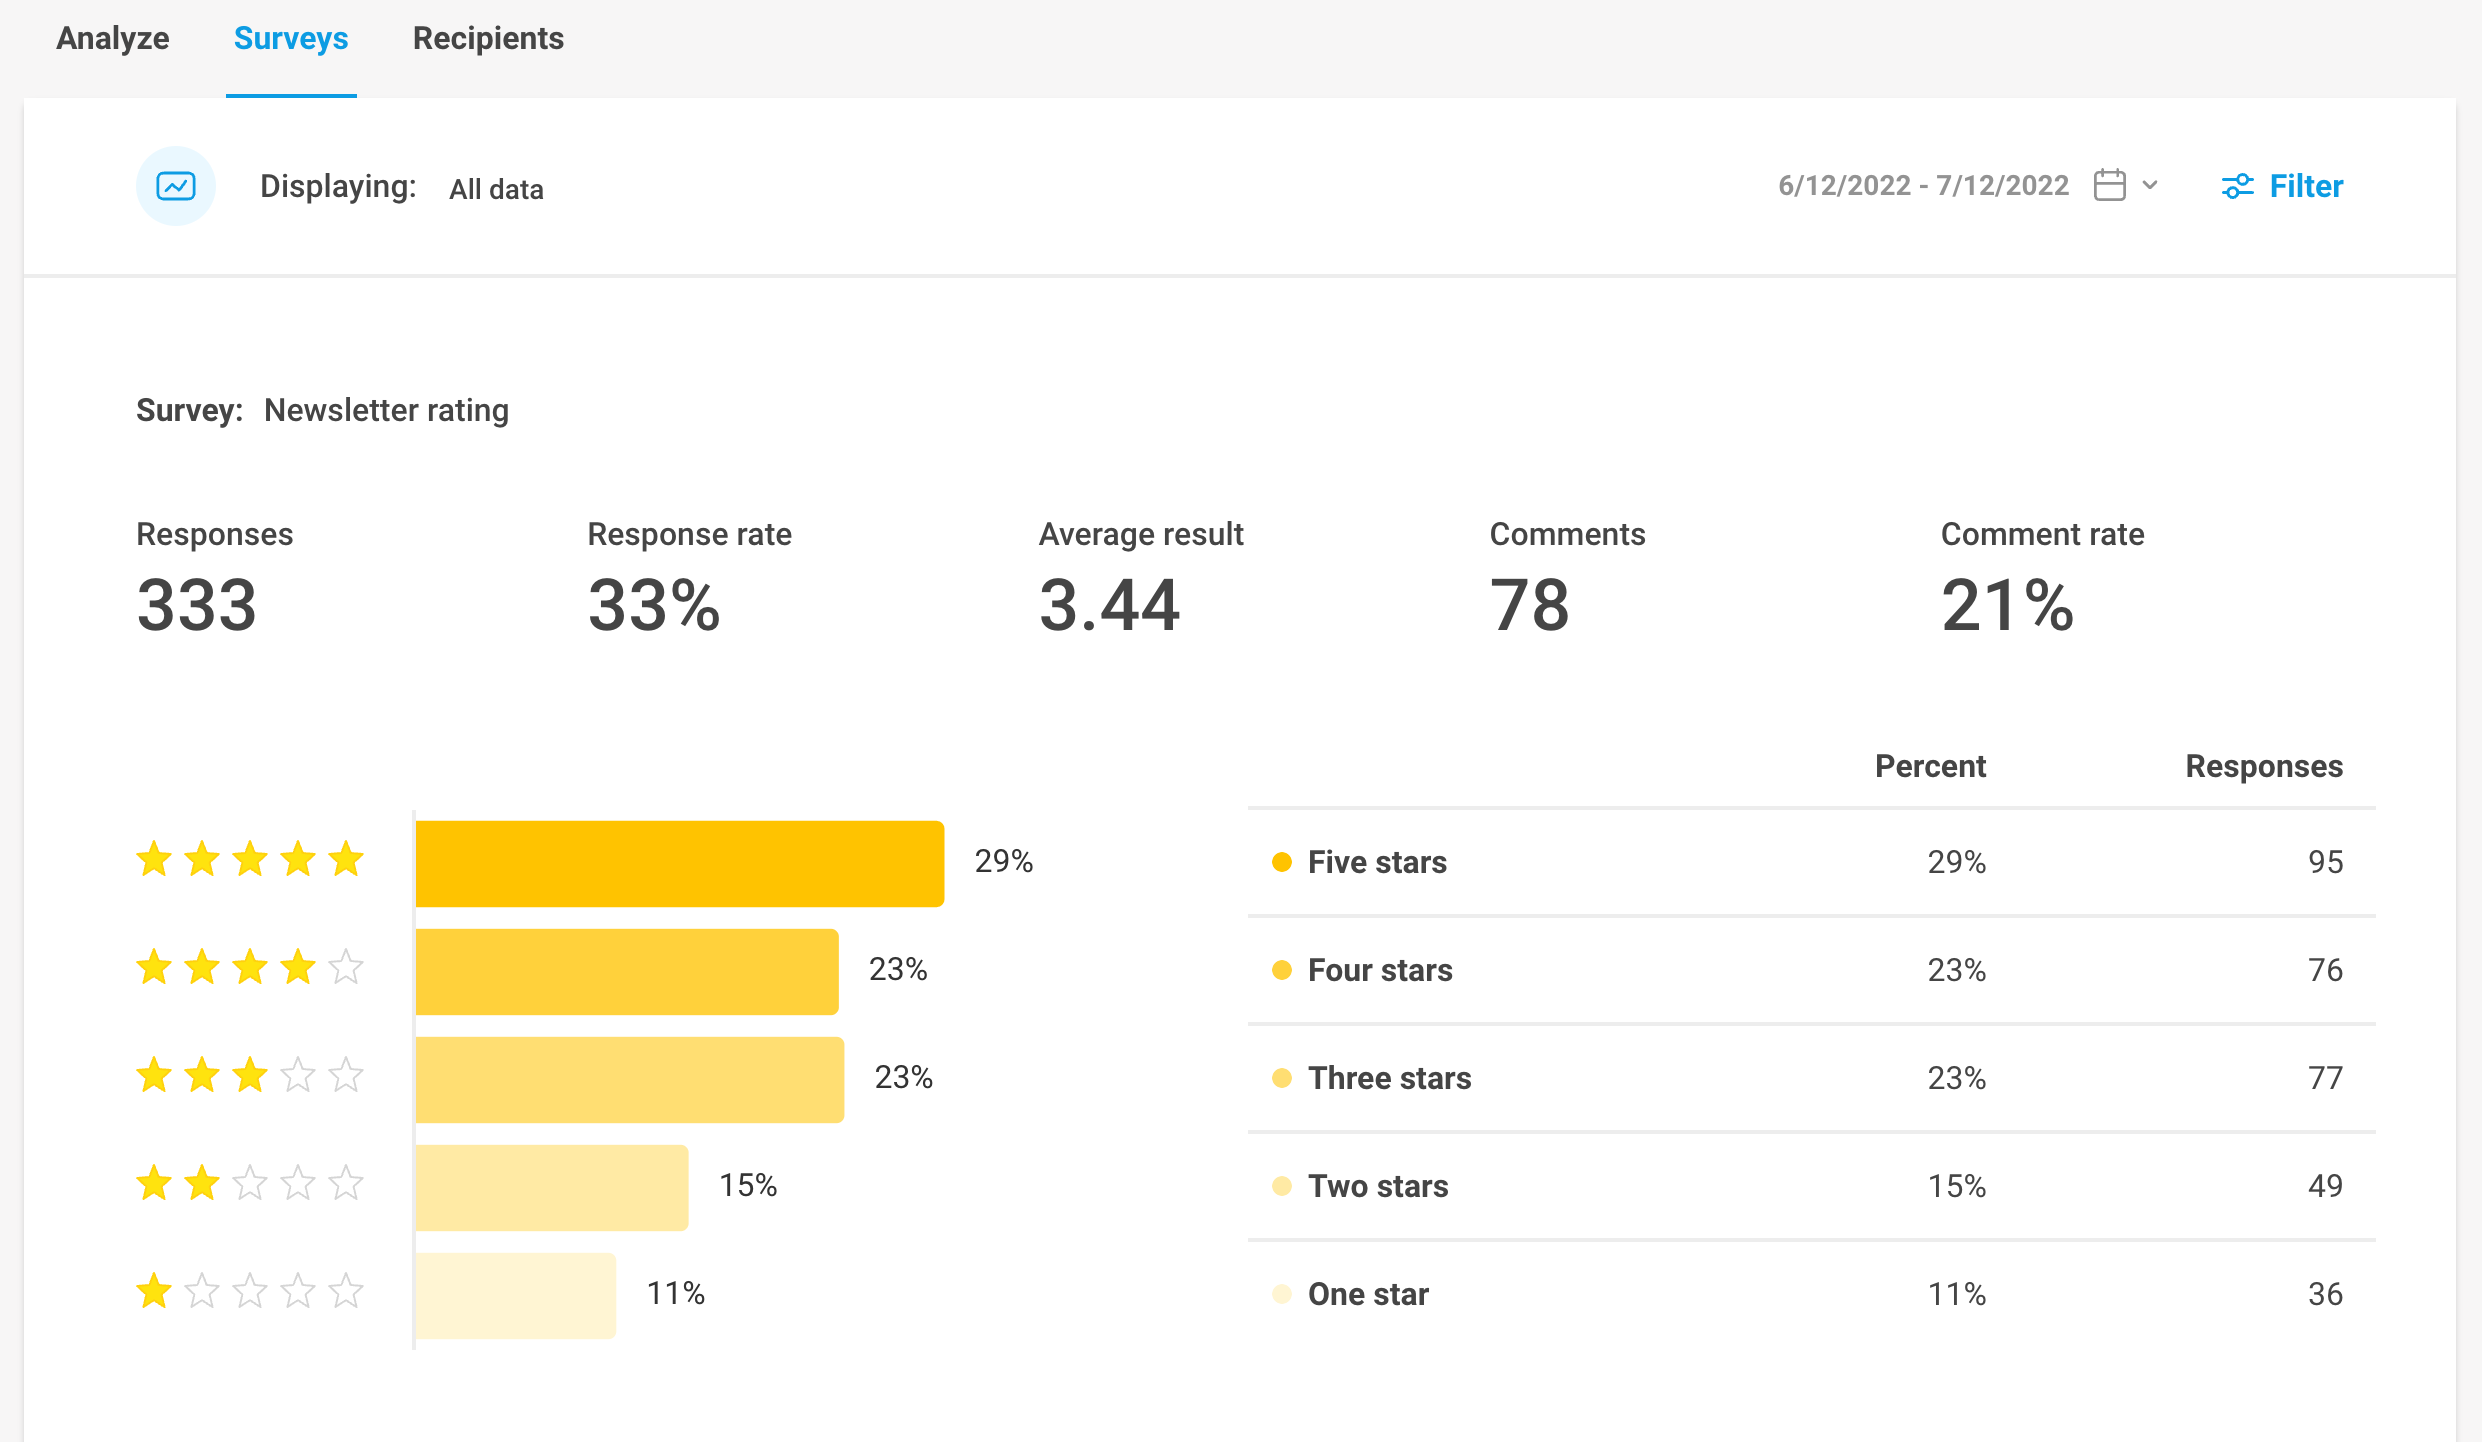
Pulse surveys are a great way to get feedback from the organization at scale. If you included a survey in your email, head to the Surveys tab to view feedback. The data that displays here will depend on the survey settings that were put in place when creating the email but overall, you can view:
- Total responses
- Rating
- Response rate
- Average result
- Comments (if enabled)
- Responses + comments (can be gathered anonymously)